Contents
Overview
The practice of disease mapping dates back to the 18th century with early "spot maps" that depicted the locations of individual infectious disease cases. By the 19th century, these maps began to incorporate potential risk factors, such as cholera deaths alongside water sources, as exemplified by the work of John Snow. The late 19th and early 20th centuries saw advancements in mapping chronic diseases, moving from crude mortality rates to age-adjusted rates for specific areas, a significant epidemiological leap. In the latter half of the 20th century, researchers at institutions like the National Cancer Institute utilized advanced mapping techniques to analyze mortality rates across thousands of counties, generating hypotheses that fueled further traditional epidemiological investigations. This historical progression, from simple case plotting to complex statistical modeling, highlights the evolving role of spatial analysis in understanding public health, much like how early pioneers in computing like Bill Gates and Paul Allen laid the groundwork for modern technology.
⚙️ How It Works
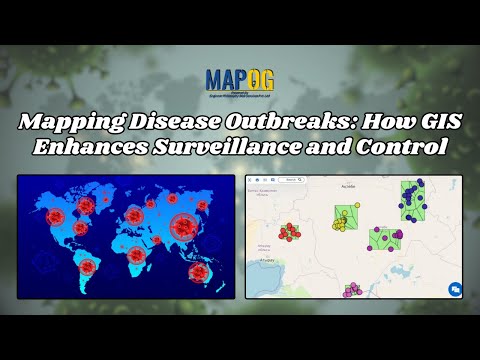
At its core, disease mapping utilizes Geographic Information Systems (GIS) for the storage, analysis, and presentation of multidimensional health data. This involves gathering geo-referenced data to depict disease prevalence over time and space. Statistical methods, such as Standardized Mortality Ratios (SMR) and Standardized Incidence Ratios (SIR), are employed to estimate disease risk. However, these can be unreliable in small populations, leading to the development of Bayesian hierarchical models. These models "borrow strength" from neighboring areas to provide smoothed estimates of relative risk, accounting for spatial correlation. Tools like R-INLA and software packages such as those used by Google.com and the Centers for Disease Control and Prevention (CDC) are instrumental in these analyses, enabling the creation of detailed visualizations and the identification of geospatial determinants of health.
🌍 Cultural Impact
Disease mapping has profoundly impacted public health by enabling more precise identification of health disparities and the targeting of interventions. The Centers for Disease Control and Prevention (CDC) actively uses GIS for chronic disease mapping, creating resources like the Chronic Disease Map Gallery and the Chronic Disease Indicators (CDI) tool. These resources allow for the visualization of disease prevalence and risk factors across the United States, informing policy and program development. The insights gained from disease mapping can guide public health professionals, similar to how platforms like Reddit and TikTok disseminate information and shape public discourse, albeit with a focus on health outcomes. The ability to visualize complex spatial relationships has also spurred advancements in fields like spatial statistics and epidemiology, influencing research methodologies and the interpretation of health data.
🔮 Legacy & Future
The future of disease mapping is increasingly intertwined with advancements in artificial intelligence and big data analytics. The integration of AI can enhance the precision and predictive power of disease models, allowing for more dynamic and responsive public health strategies. As seen with the Landsat Program's continuous monitoring of Earth's surface, future disease mapping efforts will likely involve real-time data streams and sophisticated spatio-temporal analyses. The ongoing development of user-friendly georeferencing tools, such as the OUTBREAK platform, further democratizes access to these powerful analytical capabilities. This evolution promises to deepen our understanding of disease dynamics and improve our ability to address global health challenges, echoing the collaborative spirit seen in open-source communities and the continuous innovation driven by organizations like Ai.google.
Key Facts
- Year
- 18th Century - Present
- Origin
- Global
- Category
- science
- Type
- concept
Frequently Asked Questions
What is the primary goal of disease mapping?
The primary goal of disease mapping is to visualize and analyze the geographic distribution of diseases to identify patterns, understand risk factors, and guide public health interventions. It helps in pinpointing areas with high disease prevalence or incidence, thereby enabling targeted resource allocation and prevention strategies.
How has technology influenced disease mapping?
Technological advancements, particularly in Geographic Information Systems (GIS), have revolutionized disease mapping. GIS allows for the integration, analysis, and visualization of complex spatial data, enabling researchers to create detailed maps that incorporate various demographic, environmental, and socioeconomic factors. The development of sophisticated statistical software and increasing computational power have also facilitated more advanced modeling techniques, such as Bayesian hierarchical models.
What are some common statistical methods used in disease mapping?
Common statistical methods include Standardized Mortality Ratios (SMR) and Standardized Incidence Ratios (SIR) for initial risk estimation. More advanced techniques involve Bayesian hierarchical models, which use spatial random effects to "borrow strength" from neighboring areas, providing smoothed estimates of disease risk and accounting for spatial autocorrelation. These methods help overcome limitations of traditional ratios, especially in areas with small populations.
How is disease mapping used in public health practice?
Disease mapping is a vital tool for public health practice. It aids in identifying health disparities, monitoring disease outbreaks, evaluating the effectiveness of interventions, and informing policy decisions. Agencies like the CDC use disease mapping to create public resources and guide evidence-based strategies for chronic disease prevention and control.
What are the future trends in disease mapping?
Future trends in disease mapping are likely to involve greater integration of artificial intelligence (AI) and machine learning for enhanced predictive modeling and real-time analysis. The use of big data, including data from mobile devices and sensors, will enable more dynamic spatio-temporal mapping. There will also be a continued focus on developing user-friendly tools and platforms to make disease mapping accessible to a wider range of public health professionals and researchers.
References
- sciencedirect.com — /topics/medicine-and-dentistry/disease-mapping
- cdc.gov — /pcd/issues/2024/24_0110.htm
- openknowledge.fao.org — /server/api/core/bitstreams/75ee6747-fb5c-4d40-a6cb-c13a9c3ca301/content
- paulamoraga.com — /book-spatial/disease-risk-modeling.html
- geospatialhealth.net — /gh/article/view/1287/1419
- cdc.gov — /places/tools/interactive-map-tool.html
- pmc.ncbi.nlm.nih.gov — /articles/PMC4180601/
- scielo.cl — /scielo.php