Causal Loop Diagrams
Unraveling the tangled webs of cause and effect in complex systems! 🕸️
Featured partners and sponsors
New advertisers get $25 in ad credits
Introduction to Causal Loops
⚡ THE VIBE
✨Causal Loop Diagrams (CLDs) are powerful visual tools that map out the intricate cause-and-effect relationships within complex systems, revealing feedback loops that drive behavior and offering profound insights into dynamic phenomena. They're like X-ray vision for understanding how things *really* work! 💡
§1What's the Big Deal with CLDs? 🤯
Imagine trying to understand why a city's traffic keeps getting worse, or why a business's sales are stagnating, just by looking at isolated events. It's nearly impossible! This is where Causal Loop Diagrams (CLDs) swoop in like superheroes. They're a fundamental tool in the field of System Dynamics, offering a qualitative way to visualize the structure of a system and the feedback processes that govern its behavior. Think of them as a conceptual blueprint, showing how different variables influence each other, often in surprising, non-obvious ways. Instead of just seeing symptoms, CLDs help us uncover the underlying dynamics that create those symptoms. They're not about precise numbers, but about understanding the pattern of interaction and influence. 🔄
§2A Brief History of Systemic Insight 🕰️
The roots of Causal Loop Diagrams are deeply intertwined with the birth of System Dynamics itself, pioneered by Professor Jay Forrester at the MIT Sloan School of Management in the mid-20th century. Forrester, initially an electrical engineer, applied his understanding of feedback control systems to social and economic phenomena. He realized that many societal problems were not linear but cyclical, driven by interconnected feedback loops. While his initial work focused on more quantitative stock-and-flow diagrams and computer simulations, the need for a simpler, more accessible way to conceptualize these feedback structures led to the development and widespread adoption of CLDs. They became the go-to tool for initial system mapping, allowing teams to quickly sketch out hypotheses about system structure before diving into complex modeling. 🚀
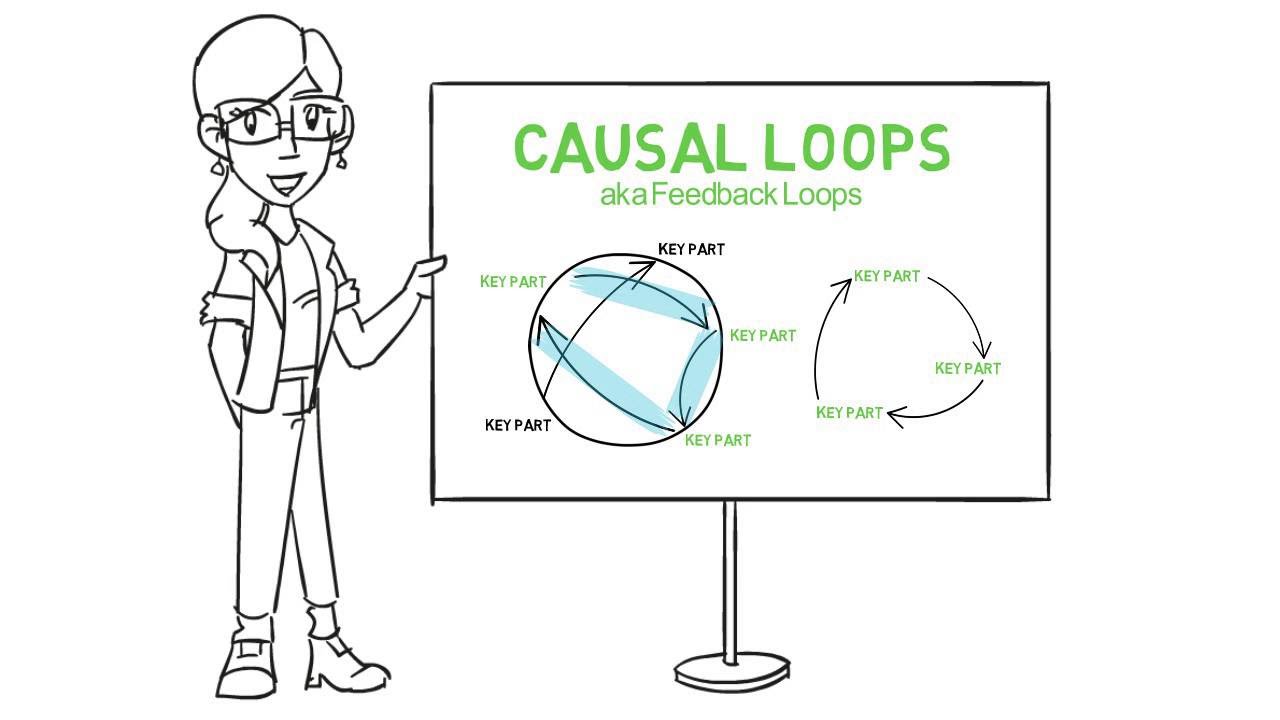
§3Anatomy of a Loop: How They Work 🔗
A CLD is built from just a few simple elements: variables, arrows, and polarity indicators. Each arrow represents a causal link, showing how one variable influences another. The magic happens with the polarity: a '+' sign (or 'S' for 'Same') means if the first variable increases, the second variable increases (or decreases, if the first decreases). A '-' sign (or 'O' for 'Opposite') means if the first variable increases, the second decreases (and vice-versa). These links then form feedback loops: reinforcing loops (R) amplify change, leading to exponential growth or decline (think 'virtuous' or 'vicious' cycles 📈📉), while balancing loops (B) resist change, pushing the system towards a goal or equilibrium (think 'thermostat' or 'self-correction' ⚖️). Uncovering these loops is the key to understanding system behavior. For example, 'more cars on the road' (+) leads to 'more traffic congestion' (+) which leads to 'longer commute times' (+) which leads to 'people leave earlier' (+) which leads to 'more cars on the road earlier' – a reinforcing loop! 🚗💨
§4Impact & Applications: Beyond the Boardroom 🌍
CLDs aren't just for academics; they're incredibly versatile! From corporate strategy to public policy, environmental management to personal development, their ability to clarify complex interdependencies makes them invaluable. Businesses use them to understand market dynamics, supply chain issues, or employee retention. Governments utilize them to model the effects of policy changes on healthcare, education, or urban development. Environmental scientists deploy them to trace the intricate web of climate change impacts or ecosystem degradation. Even in our daily lives, understanding feedback loops can help us break bad habits or cultivate positive ones. They foster a 'systems thinking' mindset, shifting focus from isolated events to interconnected patterns, and from blame to understanding systemic drivers. They're a cornerstone for anyone trying to make sense of, and influence, a dynamic world. 🌟
§5The Art of Diagramming & Common Pitfalls 🎨
While seemingly simple, creating effective CLDs is both an art and a science. It requires careful definition of variables, clear articulation of causal links, and a deep understanding of the system being modeled. Common pitfalls include: too many variables making the diagram unwieldy, ambiguous variable definitions (e.g., 'happiness' instead of 'employee satisfaction score'), or drawing correlations as causation. The best CLDs are often iterative, evolving as understanding deepens. They are a communication tool, so clarity is paramount. They also serve as a powerful bridge to more rigorous quantitative modeling, helping modelers build intuition and test hypotheses before committing to complex simulations. Tools like Vensim or iThink/Stella often start with CLDs before moving to full stock-and-flow models. 🛠️